Part 2 of 3: Plotly in React – Display Multiple Selections with Annotations
How to give the user selection capabilities by drawing boxes and polygons in plotly, along with allowing them to persist multiple selections on the plot and having those selections labeled with annotations
In this article…
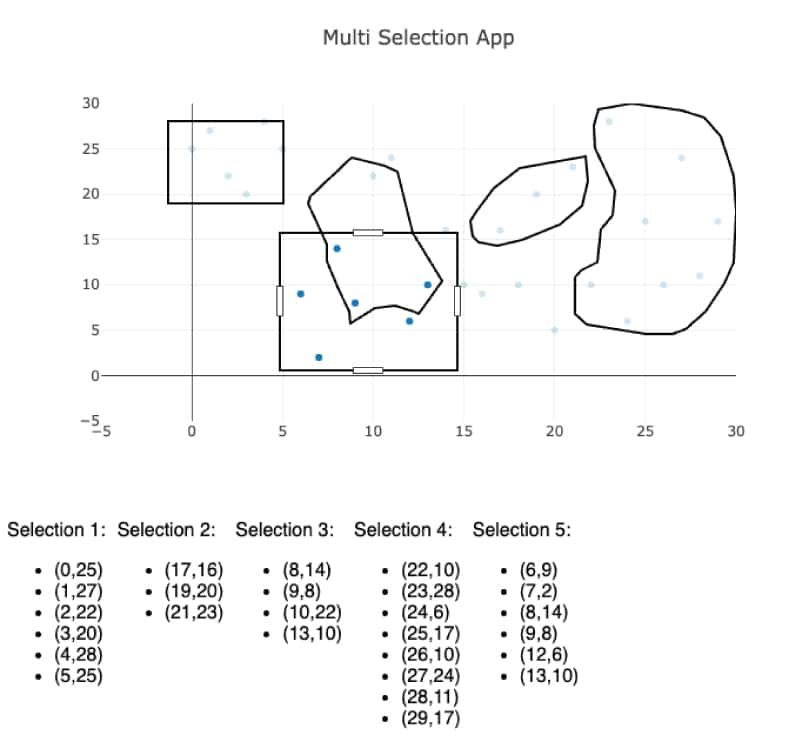
In this article, I will be showing you how to use plotly’s selection capabilities to draw multiple selections to the plot, along with having those selections individually labelled with plotly’s annotations.
What do you mean by multiple selections with annotations?
Plotly’s out-of-the-box Plot allows a user to make a selection for any chart that involves (x,y) coordinates, but that selection disappears after a user releases the mouse. It takes a bit of extra work, which is what this article will go into, to allow multiple selections to be displayed.
Annotations in plotly are labels that can be layered onto the plot. Since we’ll be displaying multiple selections, we’ll need some sort of label affixed to the polygonal selection to differentiate them from each other.
What you should know beforehand
Steps in creating this multiselection data plot
Create new sandbox environment in codesandbox.io from sandbox in Part 1 (Plotly in React – Real time data visualization)
Open the app created in Part 1 and click the Fork button at the top right. This will create a new, distinct app that is a copy of your old one.
Alternatively, you could create a new app in codesandbox.io using the steps given in the article from Part 1, and simply copy and paste the code in App.tsx.
Remove useEffect statement and code cleanup
There is a useEffect statement and a single react hook in App.tsx that are both no longer needed. You can safely remove both and your App.tsx should now look like this:
export default function App() {
 return (
   <div className="App">
     <Plot
       data={[data]}
       layout={{
         title: "Real-time Data App",
         xaxis: { range: [-5, count] },
         yaxis: { range: [-5, count] }
       }}
     />
   </div>
 );
}
Change Plot.data type and seed with random data
Above the line where you declare App.tsx, create a new function which returns an array of `count` length, with random numbers populated inside:
const randomNumbers = Array(count)
 .fill(1)
 .map((_, i) => Math.floor(Math.random() * count));
       data={[
         {
           x: startingNumbers,
           y: randomNumbers,
           mode: "markers"
         }
       ]}
       layout={{
         title: "Multi Selection App",
         xaxis: { range: [-5, count] },
         yaxis: { range: [-5, count] }
       }}
     />
– Learn more about plotly mode here
Your app should now look something like this:
Note: with this new mode, we also get some extra buttons in the top right. Hover over each one to familiarize yourself with the, particularly the selection buttons “Box Select” and “Lasso Select”
Create selection state hook and populate it with selection event
Create a new file in the same directory as App.tsx and call it “types.ts”
import { PlotSelectionEvent, Shape } from "plotly.js";

export type PlotSelectionState = PlotSelectionEvent & {
 selections?: Partial<Shape>[];
};
export default function App() {
 const [allSelections, setAllSelections] = React.useState<
   PlotSelectionState[]
 >([]);
 const setPointsAsSelected = (cs?: PlotSelectionState) => {
   if (cs && cs.points?.length > 0) setAllSelections((curr) => [...curr, cs]);
 };

 return (
   <div className="App">
     <Plot
       onSelected={setPointsAsSelected}
       …
Note: Plotly openly admits that there are some circumstances where they break React rules and modify props: https://github.com/plotly/react-plotly.js/#basic-props. It’s just something to live with for the moment.
Pass selections to Plot.layout.shapes
In Plot.layout, update the properties to match what is shown here:
      layout={{
         title: "Multi Selection App",
         xaxis: { range: [-5, count] },
         yaxis: { range: [-5, count] },
         dragmode: "lasso",
         uirevision: 1,
         shapes: allSelections
           ? allSelections.flatMap((x) =>
               x.selections
                 ? { ...x.selections[0], line: { dash: "solid" } }
                 : []
             )
           : undefined
       }}
Note: You should now notice that lasso or box selections persist in your app!
Display selection details as text below Plot
Below your Plot component, create a new component with the following code:
     <div style={{display:'flex'}}>
       {allSelections.map((x, i) => (
         <div style={{marginRight: '10px'}}>
           Selection {i + 1}:
           <ul>{x && x.points.map((p) => <li>{`(${p.x},${p.y})`}</li>)}</ul>
         </div>
       ))}
     </div>
Create Undo Last Selection button
Above your Plot component, create a button that will slice off the selection object at the end of your allSelections array like this:
     <button onClick={() => setAllSelections((curr) => curr.slice(0, -1))}>
       Undo Last Selection
     </button>
Create Clear All Selections button
In addition to the button above, create another button that will clear all selections
Create getAnnotationsForSelections function
The remaining two steps for this article will deal with adding annotations for each label so we can know which polygon is associated with which selection.
First, add a new type in the `types.ts` file called Coord:
export type Coord = { x?: number; y?: number };import { Coord, PlotSelectionState } from "./types";
import { Annotations } from "plotly.js";
export function getAnnotationsForSelections(
allSelections: PlotSelectionState[]
): Partial<Annotations>[] {
const annotations = allSelections.flatMap((selection, i) => {
if (!selection) return [];
const { lassoPoints, range } = selection;
let highestPoint: Coord;
if (lassoPoints) {
const highestYCoord = Math.max(...lassoPoints.y);
const i = lassoPoints.y.findIndex((y) => y === highestYCoord);
highestPoint = { x: lassoPoints.x[i], y: lassoPoints.y[i] };
} else {
highestPoint = { x: range?.x[0], y: range?.y[1] };
}
return {
x: highestPoint?.x,
y: highestPoint?.y,
text: `Selection ${i + 1}`
} as Partial<Annotations>;
});
return annotations;
}
Populate Plot.layout.annotations with values from getAnnotationsForSelections
Finally, back in App.tsx set the Plot.layout.annotations property with the return value of the function:
       layout={{
         …
         annotations: getAnnotationsForSelections(allSelections),
         …
You can see an already built sandbox here: https://codesandbox.io/s/plotly-multi-selection-59c1u9?file=/src/App.tsx
Conclusion
In the next and final article (Part 3 of 3), we’ll look at how we can merge overlapping selections.
3-Part Series:
- Part 1 of 3: Plotly in React – Real time data visualization
- Part 2 of 3: Plotly in React – Display Multiple Selections with Annotations
- Part 3 of 3: Part 3 of 3: Plotly in React – Merge Multiple Selections using polygon-clipping
About Intertech
Intertech is a Software Development Consulting Firm that provides single and multiple turnkey software development teams, available on your schedule and configured to achieve success as defined by your requirements independently or in co-development with your team. Intertech teams combine proven full-stack, DevOps, Agile-experienced lead consultants with Delivery Management, User Experience, Software Development, and QA experts in Business Process Automation (BPA), Microservices, Client- and Server-Side Web Frameworks of multiple technologies, Custom Portal and Dashboard development, Cloud Integration and Migration (Azure and AWS), and so much more. Each Intertech employee leads with the soft skills necessary to explain complex concepts to stakeholders and team members alike and makes your business more efficient, your data more valuable, and your team better. In addition, Intertech is a trusted partner of more than 4000 satisfied customers and has a 99.70% “would recommend” rating.


